Google rolled out its Page Experience update algorithm in 2021 that factored in page experience as a ranking signal.
As of now, Google uses more traditional and objective signals like on-page targeting and PageRank. However, the change will include page user experience in the SERPs.
To stay on top of these upcoming changes, you need to understand the different aspects of page experience and take measures to optimize your website for them.
Fortunately, Google has provided a list of elements that will be considered when determining the overall user experience of a web page. These are Core Web Vitals, mobile-friendliness, safe browsing, HTTPS, and non-intrusive interstitials.
Website owners, particularly eCommerce store owners, need to prepare their website for the Core Web Vitals algorithm change. According to a recent report, only 13% of eCommerce websites pass the Core Web Vitals. Failing to implement them means your site could fall in search rankings – especially if your competitors do implement them.
In this post, we’ll take a look at what Core Web Vitals are and take a look at how they can enable you to optimize your site’s experience. Along the way, we’ll also share some actionable tips to help you optimize your website for Google’s algorithm update.
What Are Core Web Vitals?
Google offers a complete guide called Web Vitals that contains information about quality signals that are important for offering a great user experience on the internet. Over the years, Google has released a number of tools that help developers measure site performance. However, most website owners find it difficult to keep up with these tools as well as the key metrics involved in measuring website performance.
The Web Vitals initiative enables site owners to better understand and measure the quality of user experience their site delivers, enabling them to focus on improving performance metrics known as the Core Web Vitals.
Whether you’re an online business owner, developer, or marketer, you can use Web Vitals to measure the quality of the user experience your website delivers and discover areas where you can optimize website performance.
In addition to the Core Web Vitals, there are also other Web Vitals that serve as supplemental or proxy for the Core Web Vitals. They are used for either capturing a large part of the site experience or help in finding a specific issue.
For example, the metrics First Contentful Paint (FCP) and Time to First Byte (TTFB) are both crucial facets of the site loading experience, and both help diagnose issues with LCP (render-blocking resources or slow server response times, respectively) – more on this later.
Similarly, metrics such as Time to Interactive (TTI) and Total Blocking Time (TBT) are lab metrics that are crucial in finding and diagnosing possible interactivity issues that affect FID. However, these metrics are not included in the Core Web Vitals as they can’t be measured in the field and they don’t give user-centric outcomes.
Three Important Core Web Vitals Signals
Let’s take a look at the three important Core Web Vitals signals and what they measure. By understanding the following three signals you’ll be in a better position to diagnose and fix these issues on your own. We’re using our Shoptimizer theme demo as the example.
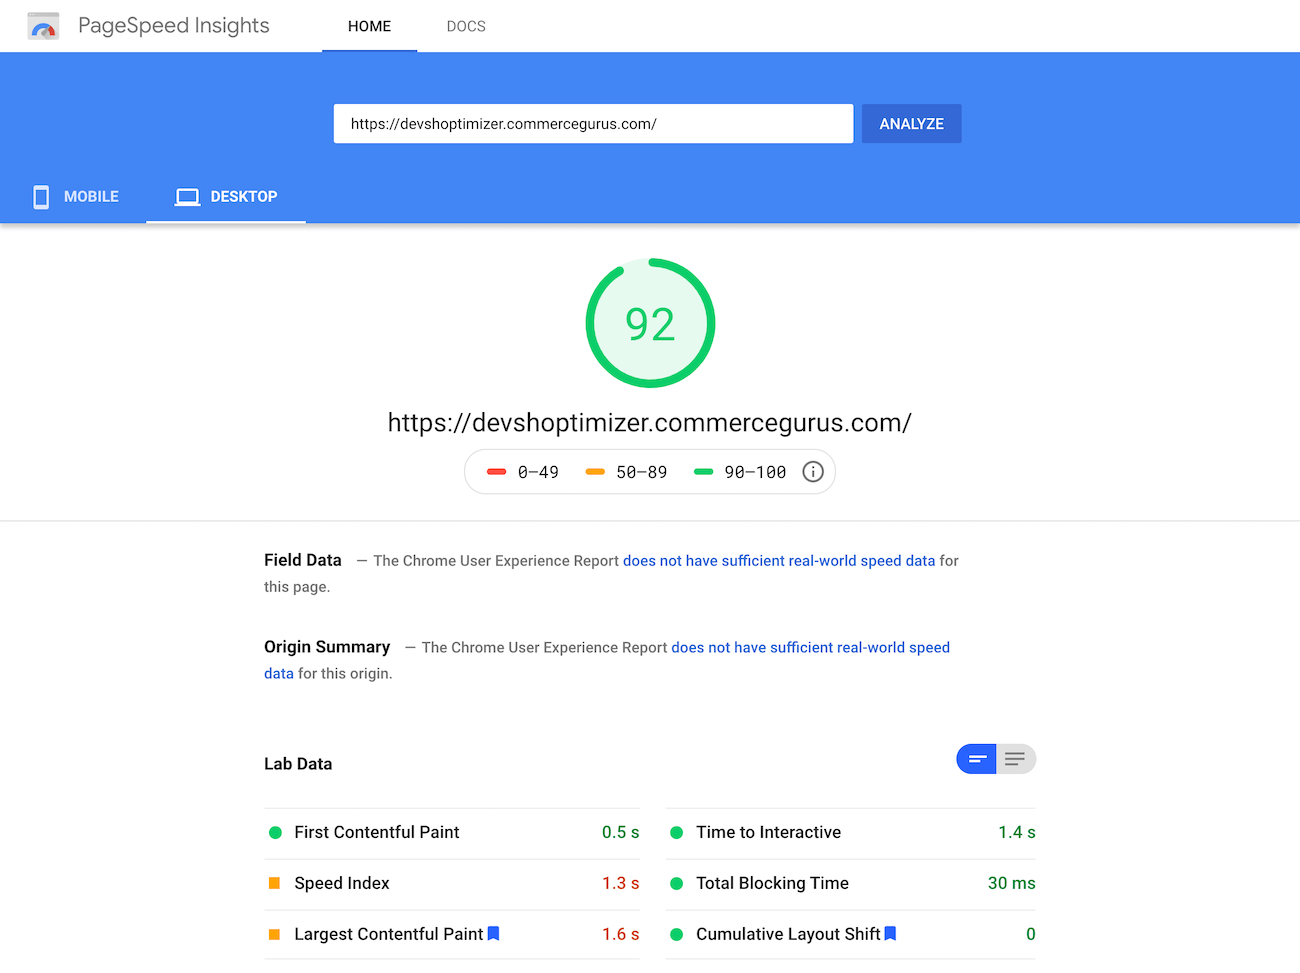
1. Largest Contentful Paint (LCP)
This signal deals with how fast a site page loads. This is largely decided by factors such as the render time and the largest video, image, and text in the user’s visible area of a web page.
Google looks at this metric to find out how long it takes for the largest piece of content to load, regardless of the size of the device or the type of content on the page. LCP can be impacted by your CSS, your server time, and client-side rendering.
2. Cumulative Layout Shift (CLS)
Cumulative layout shift (CLS) helps Google know how fast a site page becomes stable. Here’s a pretty common scenario that you might be able to relate to: Sometimes, when you open a site on your mobile phone and click a button, the button shifts its position and you end up clicking something else. Or maybe a site element in the page layout doesn’t seem to be in the right place.
This results in a bad user experience. This is how Google knows when a page is not stable fast enough. One of the main reasons why site pages take time to become stable is when image sizes are not defined. So, let’s say you have an image that is 300 pixels tall and 300 pixels wide. Ideally, you should define it in the page’s HTML. Other things that also affect cumulative layout shift include animations and ads.
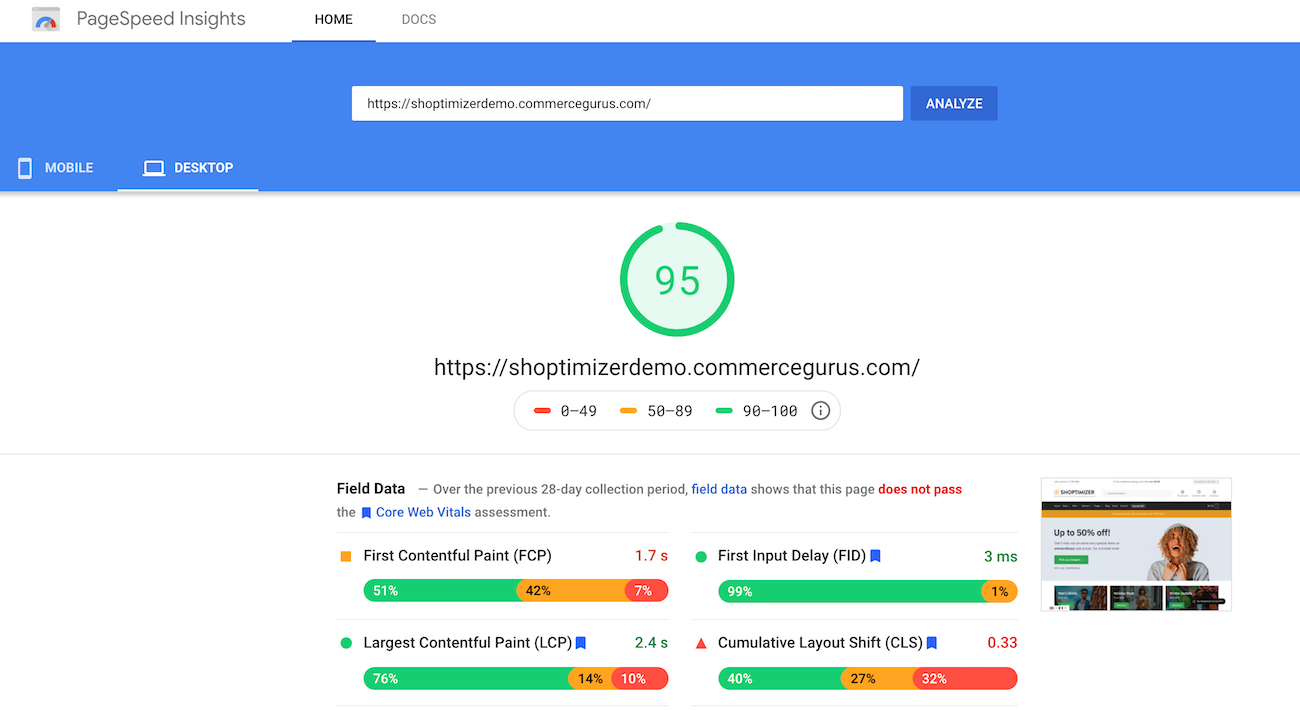

From our Core Web Vitals scores on Google PageSpeed Insights, you’ll notice that Shoptimizer’s CLS score is 0 which is pretty difficult to achieve. However, it’s important that the WooCommerce theme you choose to go with has a low CLS score.
3. First Input Delay (FID)
First input delay (FID) is a Core Web Vitals metric that tells Google how fast a page becomes interactive. In other words, when you click on, let’s say a button or a JavaScript element, how fast can the browser start processing that and produce an outcome?
A bad experience would be if you click on a button and nothing happens or the reaction is very slow. There are many things that affect first input delay including third-party code and JavaScript. There are different ways you can identify and diagnose these issues on your own.
Tools for Measuring Core Web Vitals
Below we’ll take a look at tools that can help you gauge your site’s Core Web Vitals scores:
Google Search Console
You can access your website’s Core Web Vitals data by going to Google Search Console’s “Enhancements” section. The data in Search Console is aggregated from the Chrome User Experience Report.
Google gives you access to detailed documentation on Core Web Vitals that includes exact information about which Google Webmaster tools can help you check these metrics on your website.
You can get a Core Web Vitals Report by using Google Search Console and quickly check the performance of your site’s pages.
Google Lighthouse
Google Lighthouse is another great tool that can help you measure your site performance in real-time and check the fixes you’ve made. It will give you information about your site’s overall performance score as well as sub-performance score, so you can solve individual problems with your website.
For this, open web.dev in your browser and click the Measure tab. This page will give you an option to view a Google Lighthouse Report. It will look something like this:
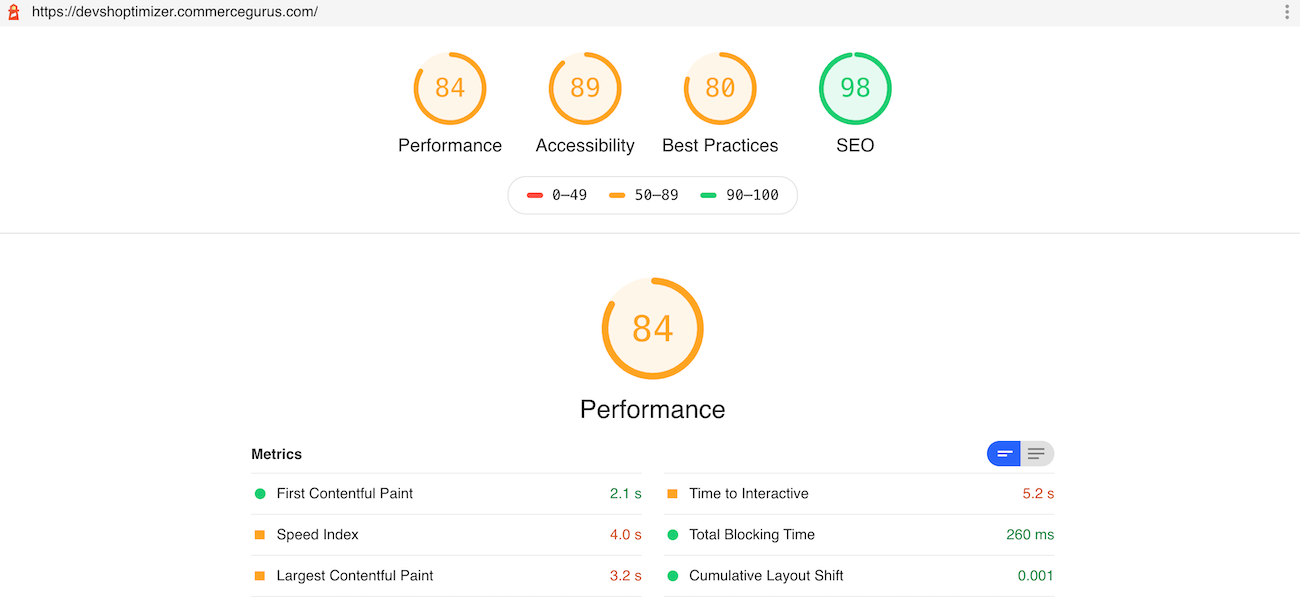
Once you’ve generated the site performance report, you’ll be able to fix these issues one by one.
How Do Core Web Vitals Affect eCommerce Stores?
Organic search is the best source of getting qualified traffic to your online store because you don’t have to spend money on ads. This makes SEO a vital part of any eCommerce site’s marketing strategy.
If you’ve already optimized your website for SEO, you need to think about how the Google update will impact your site rankings. Core Web Vitals is already helping site owners gauge the quality of user experience, and with the coming update, Core Web Vitals will become official SEO ranking metrics.
As a result, Google won’t just factor in whether or not a page contains relevant information but also the performance of the page when deciding which pages to send users to for particular keyword search terms. This means that if there are two or more pages that answer a user’s search query, Google will promote the page that offers both the correct content as well as the best user experience.
The Google algorithm is continuously modified to be able to deliver the right content to the user and offer the best user experience. In addition to affecting the search page rankings of your site, Core Web Vitals will also play a major role in deciding the amount of traffic reaching your site via organic search.
Optimizing Your Core Web Vitals Scores
Here, we’ll look at the three important Core Web Vitals and discuss some actionable tips on how you can optimize your site’s experience and implement Google’s updated recommendations.
#1: Largest Contentful Paint
For most users, page loading refers to when the largest content element of a page becomes fully visible. This is also the speed of the Largest Contentful paint (LCP).
These content elements include images (and images inside SVG files), videos, and block-level elements. On eCommerce websites, LCPs are determined by the speed with which the hero image or product image loads. If the speed of LCP is slow, this will result in a bad user experience, leading to users abandoning your online store.
LCP of:
- Less than or equal to 2.5 seconds is regarded as fast.
- Between 2.6 seconds to 4.0 seconds needs optimization.
- Greater than 4.0 seconds are considered slow.
Some of the common factors affecting LCP include:
- Long resource load times
- Slow server response times
- Client-side rendering issues
- Render-blocking JavaScript and CSS
Here are some tips that can help you improve your LCP:
- You can reduce server response time by directing site traffic to the closest CDN PoP available, using a service worker, caching assets, and creating third-party connections early with “rel”=”preconnect”.
- Improve site speed and reduce JavaScript-blocking time by compressing data using tools such as Gzip, minify JavaScript script resources (e.g. eliminate whitespace), split bundles, and only send content that’s necessary at the start.
- You can fix render-blocking CSS by removing unused CSS or unnecessary characters such as comments, indentations, and whitespace. Moreover, you can inline vital CSS by putting it directly in the head of the page.
- Optimize resource load time by compressing text and image files, use a service worker to cache assets, send different assets based on the network connection, and preload important resources.
- Reducing JavaScript-blocking time will also help you improve client-side rendering. Additionally, you can also use pre-rendering and server-side rendering to optimize it.
#2: First Input Delay
The second factor affecting their experience is how fast your site becomes responsive once they start to interact with it. First Input Delay (FID) refers to the time between when a user first interacts with a site page (e.g. presses a button or clicks a link) to the time it takes for the web browser to return an outcome.
One of the main reasons for input delay is JavaScript being run on the main thread and all JavaScript is render-blocking by default. As a result, when the web browser sees a JavaScript file, it has to pause everything else to download, parse, compile, and run that JavaScript. The more time is taken by JavaScript execution, the worse the site user experience. Google will a page like this less usable.
For Google, an FID of:
- Less than or equal to 100 milliseconds is considered fast.
- Between 1.1 and 3.0 seconds means the page needs optimization.
- More than 3.0 seconds are considered slow.
Keep in mind that in contrast to CLS and LCP, FID can’t be accessed from lab data. You need real user interaction to measure FID.
Here are some of the common causes of slow FIDs:
- First-party script execution delaying interaction readiness
- The main thread is blocked for 50 milliseconds or more due to long tasks
- Heavy JavaScript execution time
Let’s look at some of the ways you can optimize FID on your site pages:
- Reduce FID by breaking down long-running code into small, asynchronous tasks and use code-splitting.
- Take out heavy script loading and execution for unnecessary components from the main path.
- Reduce cascading data fetches as well as the amount that has to be post-processed on the user’s machine.
#3: Cumulative Layout Shift
Cumulative Layout Shift or CLS is another factor that affects the user experience and can deter customers from navigating through the intended purchase flow. It deals with how often users face unexpected layout shifts on your site pages.
This happens when the user is about to click a link or product image, and just before they touch the screen the page shifts, and the user ends up clicking something else. This may be a minor hiccup for some users. For others, this could cause them to abandon your store for a better site experience.
To calculate CLS, Google multiplies the impact fraction (i.e. how much visible content moved in the viewport) with the distance fraction (i.e. how much an unstable element shifted in the frame divided by the screen’s largest dimension, width or height). In other words:
Cumulative Layout Shift (CLS) = Impact Fraction x Distance Fraction
All the individual CLS scores resulting from each unexpected shift in the layout are added up to calculate a page’s total CLS.
For Google, a CLS score:
- Less than 0.1 is considered good.
- Between 0.1 and 0.25 is moderate.
- Over 0.25 is poor.
Here are some of the common causes of a bad CLS:
- A video, image, or ad resizing itself
- Fonts loading with delay and end up showing smaller (or larger) than intended
Let’s look at some of the ways you can optimize this metric:
- Give exact dimensions for video and image elements.
- Eliminate banner or pop-up ads. Instead, assign a large static space on your page for displaying ads.
- Eliminate flashes of invisible or unstyled text.
Conclusion
Knowing Google will update its algorithm to factor in page experience as a ranking signal, you should proactively take steps to gauge your site’s Core Web Vitals and implement the necessary improvements.
No one can say for sure how much of an impact something like LCP will have in Google’s algorithm. But, if you want to stay ahead of your competition while staying on top of search results organically, you should be prepared for any and all algorithm changes Google decides to enforce. As a result, you’ll be able to deliver a better user experience through your online store.
Ready to take the first step in optimizing your eCommerce site for speed? Get the SEO-optimized Shoptimizer WooCommerce theme today!





 Suave WooCommerce Theme Launch – plus Sample Sites
 Customizing WooCommerce Checkout Fields
 How to build a profitable eCommerce website with over $40k in sales in just 3 months
 WooCommerce 2.2 Feature – Automatic Refunds
Hey Dear, Like Your Post. Is there anyway to Fix the Pages in Bulk? Because my Sites pages are increased day by day also in search console I saw increasing errors about “LCP issue: longer than 4s (mobile) and
CLS issue: more than 0.25 (mobile)” too. Anyway to Fix this in Bulk?
We need to dig deep into ScreamingFrog to find the root cause and fix it. Otherwise, all this investigation would be a waste of time.